Toyota Late Model V6 Drive Cycle
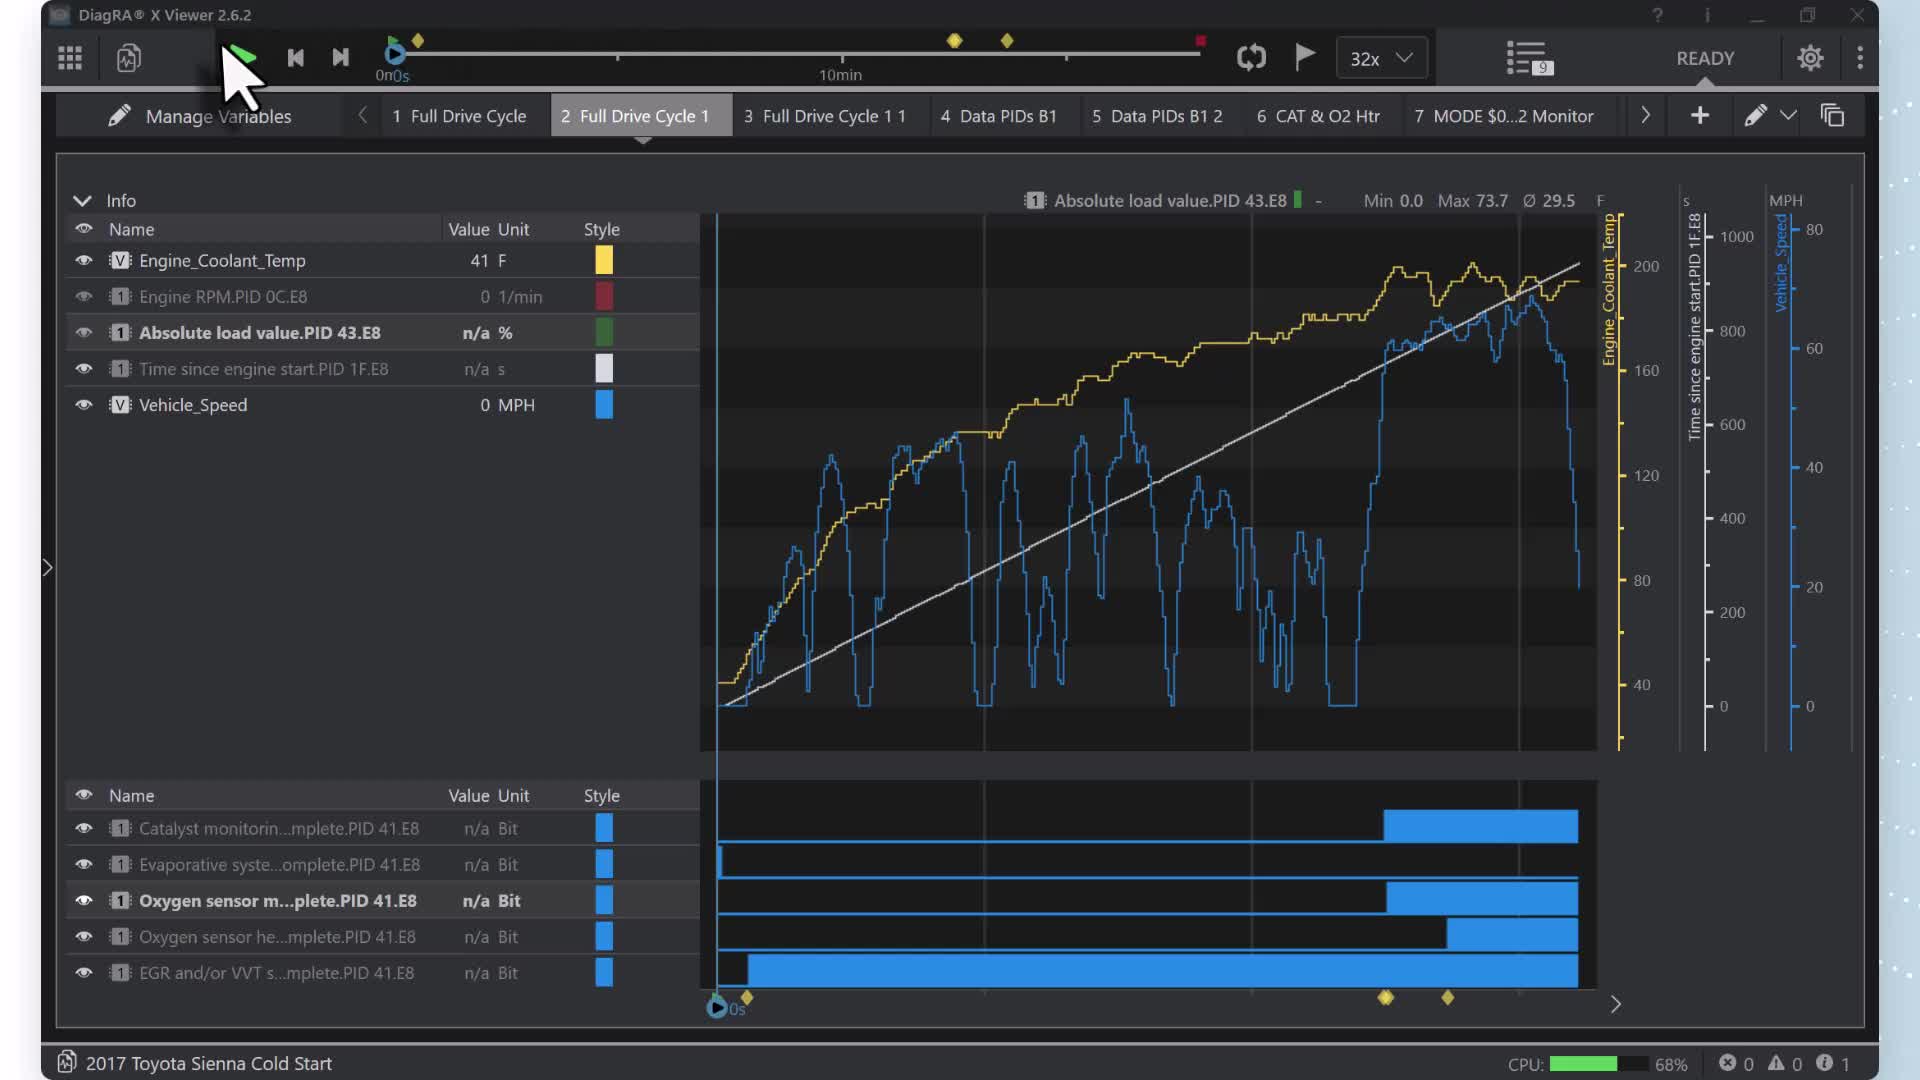
This capture is a cold start, and this leads to running the non-continuous monitor tests. The test took longer to run due to the cold startup temperature. All tests completed, except for EVAP. Not all PIDs are graphed, but their values are displayed to the left. Use your mouse to control video playback. Take note of the blue bar graph and where the tests were completed.
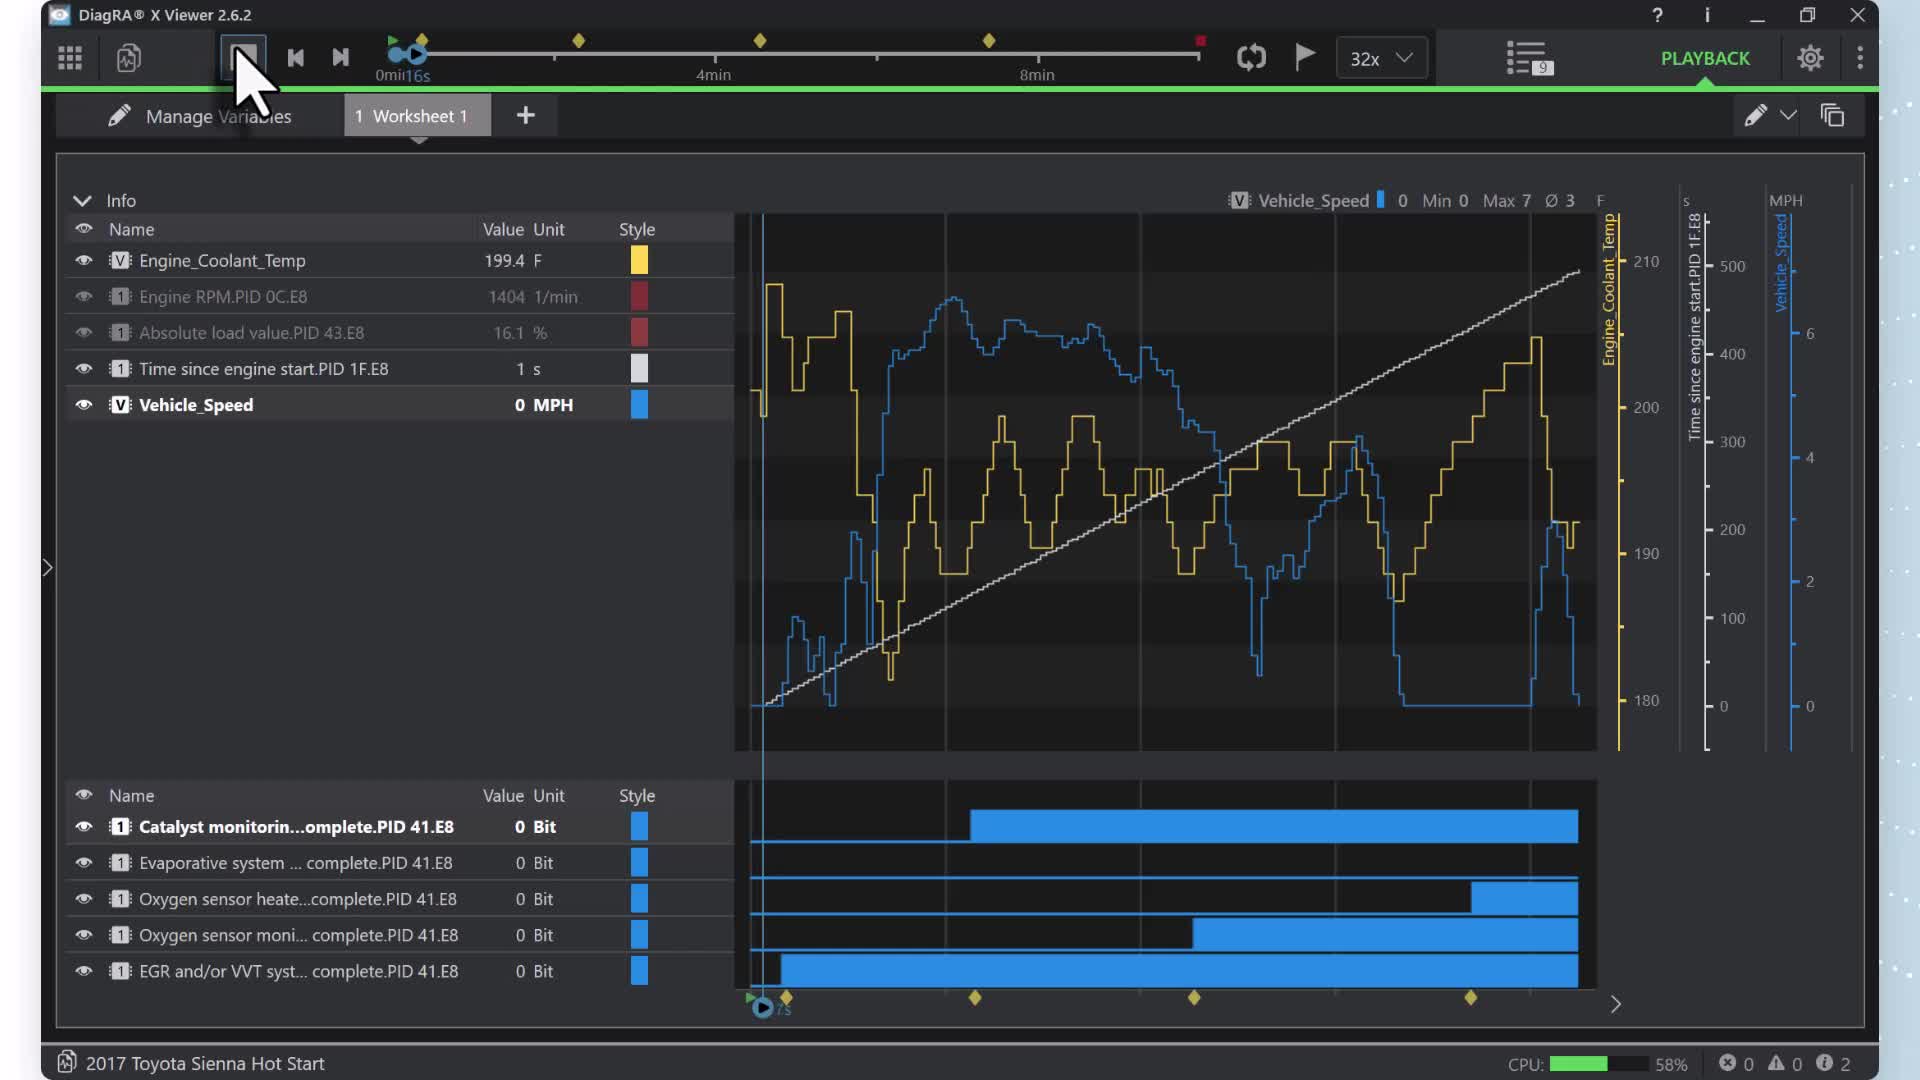
This capture is a hot restart, leading to running the non-continuous monitor tests. All tests completed, except for EVAP. The test ran faster due to the startup temperature. Not all PIDs are graphed, but their values are displayed to the left. Use your mouse to control video playback. Take note of the blue bar graph and where the tests were completed.
These two captures show how the order and timing of the drive cycle can change depending on the startup temperature and how the vehicle is driven. Do not get lost in a drive-cycle pattern; look for the window where the criteria are met.